Shelly Engelman, PhD
  • Home
  • About
    • Services
    • CLIENTS
  • SAMPLE DASHBOARDS
  • Dashboard WKSHPS
    • February 2023 Workshops
  • Tips & Tricks
  • Contact

Tip #5: Include t-tests (and other inferential statistics) into your interactive dashboards

7/2/2021

0 Comments

 
Do you work with a lot of pre/post data? Yeah...so do I! As evaluators, we often assess program efficacy by investigating gains over time. To assess pre/post gains, I like to use the retrospective pre/post survey because it efficiently and "accurately" captures change from before an intervention to after an intervention. 
Picture
One of the most time-saving techniques that I figured out over the past few years is how to integrate paired samples t-tests into my interactive dashboard. Think about it: By including t-tests, my dashboards are basically calculating scores and scores of paired samples t-tests behind the scenes!

​For instance: Say you want to know if females, in particular, showed statistically significant gains? Boom!...Click on the slicers in my interactive dashboard, and you'll get your answer in seconds! What about females who are underrepresented minority students and who are majoring in Physics? Yep...my dashboard will calculate that for you in an instant!

Want to know the steps?  

Read More
0 Comments

tip #4: include a dynamic "n" count in your interactive dashboards

6/8/2021

0 Comments

 
Picture
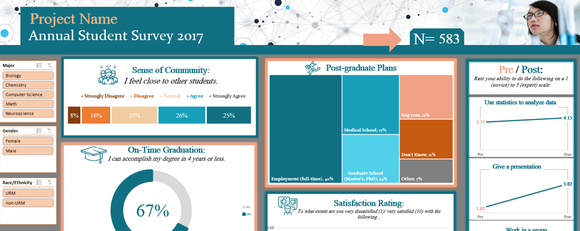
Okay...the following is an actual conversation (recreated from memory!) that I had with a client, and underscores the need to include a dynamic "n" count in your interactive dashboards...

Read More
0 Comments

tip #3: password protect your dashboards

6/8/2021

0 Comments

 
Picture
Once you've created your interactive dashboards in Excel using my famous PARCS method, you will be tempted to share your Excel workbooks with clients and colleagues. You designed something amazing, and it only makes sense that you would want to share it with the world, right?

HOLD ON! 
Aren't you forgetting something???


Read More
0 Comments

Tip #2: consider replacing your pre/post survey with a REtrospective survey...but only under certain conditions

6/8/2021

0 Comments

 
Picture
Do you use traditional pre/post surveys to assess programmatic impact on participants?  If so, you might have encountered the following known problems:

Read More
0 Comments

Tip #1: Use the PARCS Method to create an interactive dashboard in Excel

6/7/2021

0 Comments

 
Did you know that you can create an interactive dashboard in Excel? Take a look at this interactive dashboard that I made for a client!        ------------------------------------>
​The client can use the filter options on the side to slice and dice the data in seconds. The charts and figures update in real time, depending on the selected filters. 
Picture

Read More
0 Comments
    Picture

    Author

    Hi y'all! I'm Shelly Engelman, Ph.D.  
    ​I work with people like you to analyze data, design surveys, develop dashboards, and assess program impact using low cost (or no cost) tools. Here are a few of my favorite tips and tricks!

      Stay updated:

    Subscribe to Blog

    RSS Feed

Shelly Engelman, PhD           Copyright © 2023
  • Home
  • About
    • Services
    • CLIENTS
  • SAMPLE DASHBOARDS
  • Dashboard WKSHPS
    • February 2023 Workshops
  • Tips & Tricks
  • Contact