 Okay...the following is an actual conversation (recreated from memory!) that I had with a client, and underscores the need to include a dynamic "n" count in your interactive dashboards... Early one morning, I received a frantic call from a client:
Noted! Without knowing the denominator, my client freaked out over 4 students. I can't blame them. Context makes a BIG difference. Often times, dashboards fail to relay this "context" to the user. I would argue that interactive dashboards, in particular, require context to ensure proper interpretation of the data. Adding a dynamic "n" count to your dashboards is critical, but it's a little tricky to create in Excel. Here are the steps.... Step 1. Insert a pivot table and add a demographic or ID variable to the "value" field First, select your data...go to your "Insert" ribbon...and click on Pivot Tables. Once your pivot table has been created, drag and drop a demographic variable or, better yet, an ID variable into the "Values" field. You, basically, want to use a data variable that is "complete." I almost always have an "ID #" column in all of my data sheets. Sometimes the ID #s reflect actual student IDs. But, often, I just make up ID numbers for the purposes of creating a dynamic n count for my dashboards. Sneaky, right? 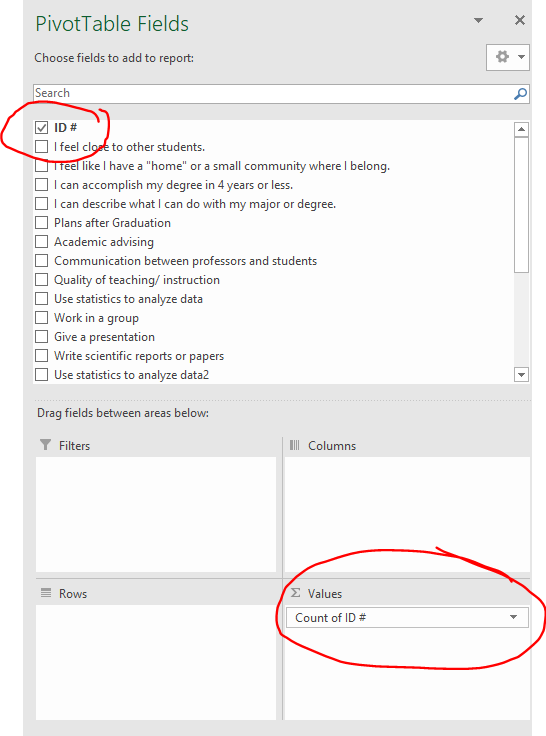 Step 2. Change the value from a "sum" to a "count" By default, Excel will try to "sum" your ID #s. Don't let it! Change the "sums" to "count" by going to the Analyze ribbon and selecting "Field Settings." Within "Field Settings," you'll want to summarize your value field by "count." In other words, select "count." Simple enough? 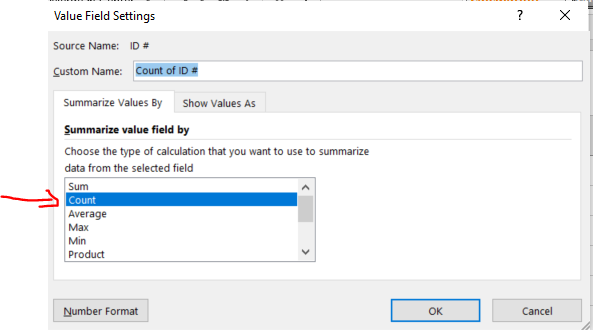 Step 3. Insert a Slicer (or make sure that your pivot table is connected to your slicers) As I've described in Tip #1, Excel slicers make the dream work. Slicers will allow you to slice and dice your dashboards. Insert your slicer by going to the "Insert" ribbon and selecting "Slicer." Once selected, you will be asked to select the variables that will serve as your filters. I usually select demographic variables like gender, race/ethnicity, etc. Step 4. Insert a text box We are going to use a text box to feature our new "n" value. Then, we're going to place this text box somewhere in our dashboard to give the user context. Insert a text box by going to the "Insert" ribbon and selecting "text box." Draw your text box to size. Step 5. Add the dynamic "n" count to your text box. All right, folks. This is where a lot of people trip up! Excel is finicky sometimes and plays by its own set of rules. To add the dynamic count to your text box, you first need to reference the n count in a cell. In this example, below, I've referenced the n count in cell B66. See that? 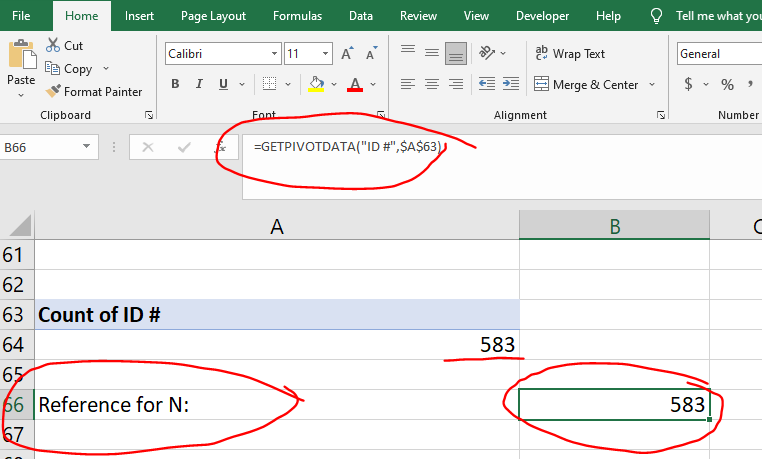 The reason why we need to create a referenced cell is because an error message pops up when we try to directly reference a number from a pivot table in a text box. It's a strange thing, I know! Let's just go with it... Once you have your referenced cell, then simply select your text box and select your referenced cell. In this example below, I selected my text box and then inserted the formula "=B66" to reference the number in cell B66. (Place $ signs around your formula to further fix the value: "=$B$66") 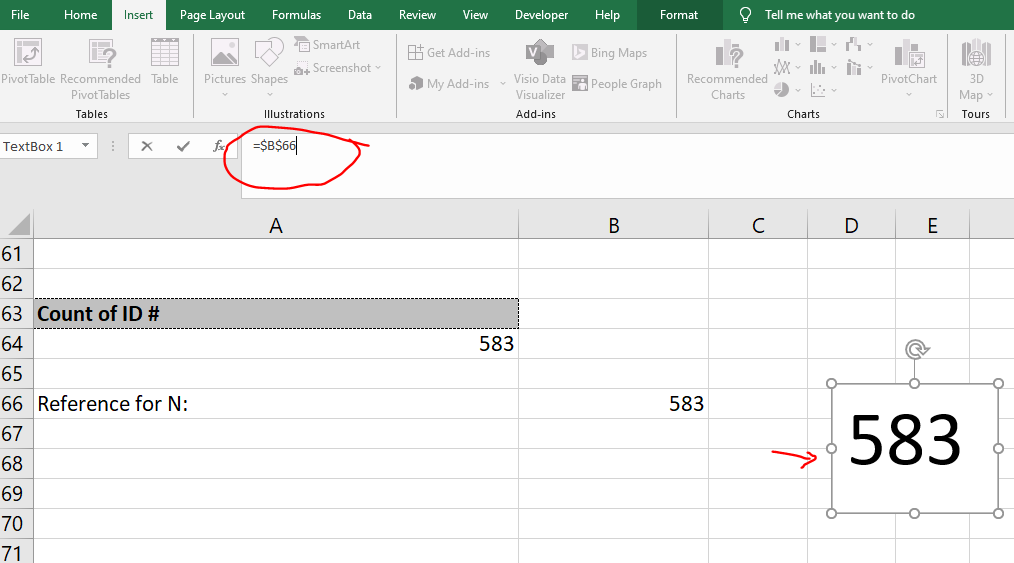 The final step is to move your text box to your dashboard. Try it out! Did your n count change as you select the slicers? If not, you might need to fix the formula in your text box to refer to the correct cell. These steps are not easy to master...but, including a dynamic n count is going to help you avoid frantic morning calls from clients. ;-) 
0 Comments
Leave a Reply. |

AuthorHi y'all! I'm Shelly Engelman, Ph.D. |
 RSS Feed